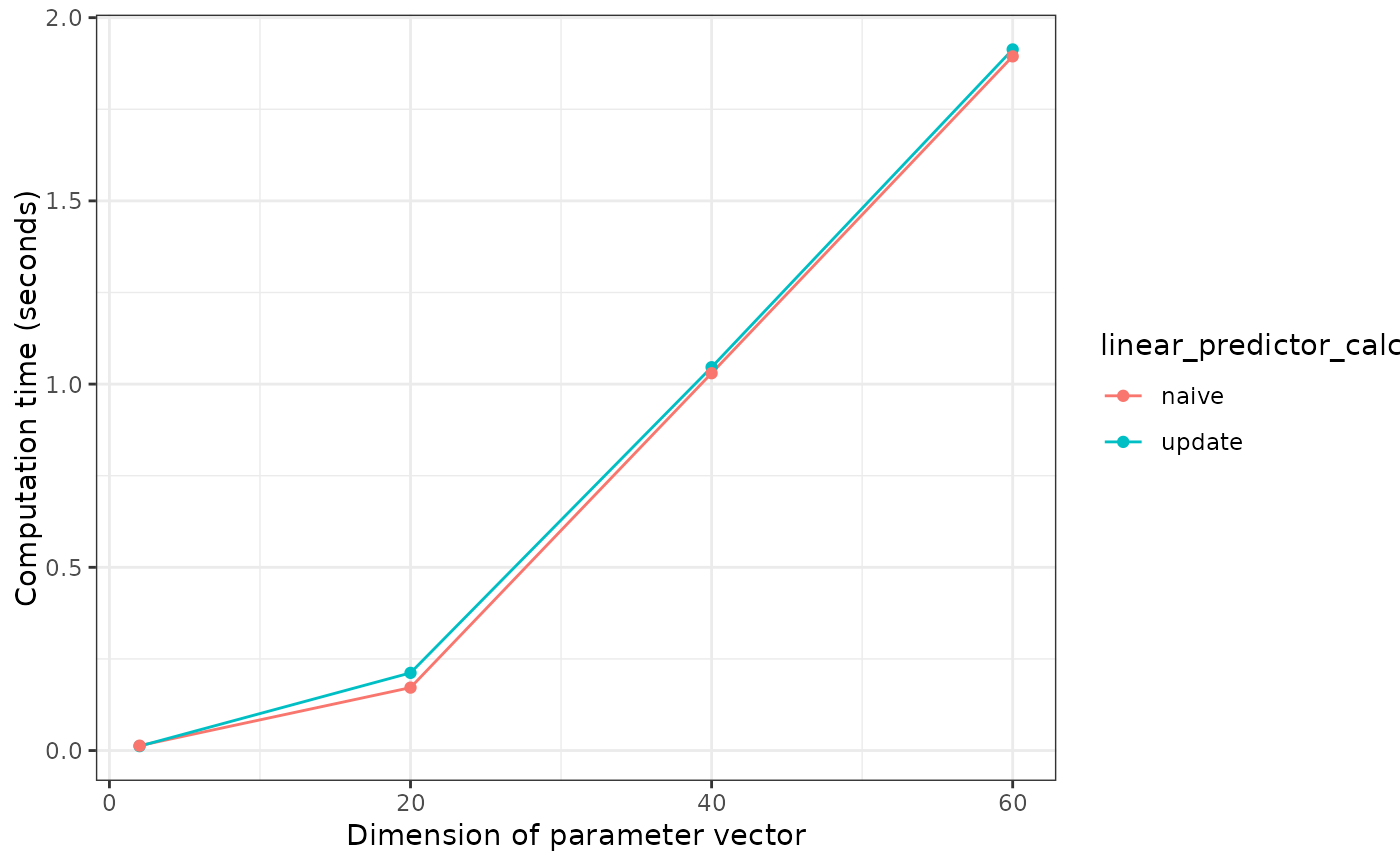
Plot the results of compare_eta_comptime_across_nvars
Source:R/measure_performance.R
plot_eta_comptime.RdPlot the results of compare_eta_comptime_across_nvars
Arguments
- eta_comptime_data
a
data.framewith results of computation times. Result of a call to compare_eta_comptime_across_nvars- facet_by
a
characterwith the variable to facet the plots by. Default is NULL, which does not produce any facets. However, a user could specify fx. "qslice_fun" after having run compare_eta_comptime_across_nvars across different slice functions. Other options are fx. running compare_eta_comptime_across_nvars for different values of a tuning parameter and seeing how that affects runtime
Examples
# Compare the runtime for 2, 20, 40, 60 variables in the model
res <- compare_eta_comptime_across_nvars(n_vars = c(2, seq(from = 20, to = 60, by = 20)),
                                         n_samples = 1,
                                         burnin = 0)
plot_eta_comptime(res)
